Technology
Technology
The prefix "tech" comes from the Greek word techne, which means "art, skill, craft, or the way, manner, or means by which a thing is gained,
The suffix "-ology" means "the study of" or "science of".
Dear Elon.
Technology will play a transformative role in the future of teaching by enabling more personalized and engaging learning experiences. With advancements in artificial intelligence, adaptive learning platforms can tailor instruction to individual student needs, ensuring that every learner progresses at their own pace. Interactive tools like virtual reality and augmented reality will make lessons more immersive, bringing abstract concepts to life and fostering deeper understanding. Additionally, technology will enhance collaboration through digital platforms, connecting students and educators globally, and providing access to diverse perspectives. Teachers can create more inclusive, innovative, and future-ready classrooms by integrating these tools.
Evidence and Commentary on Classroom Practices.
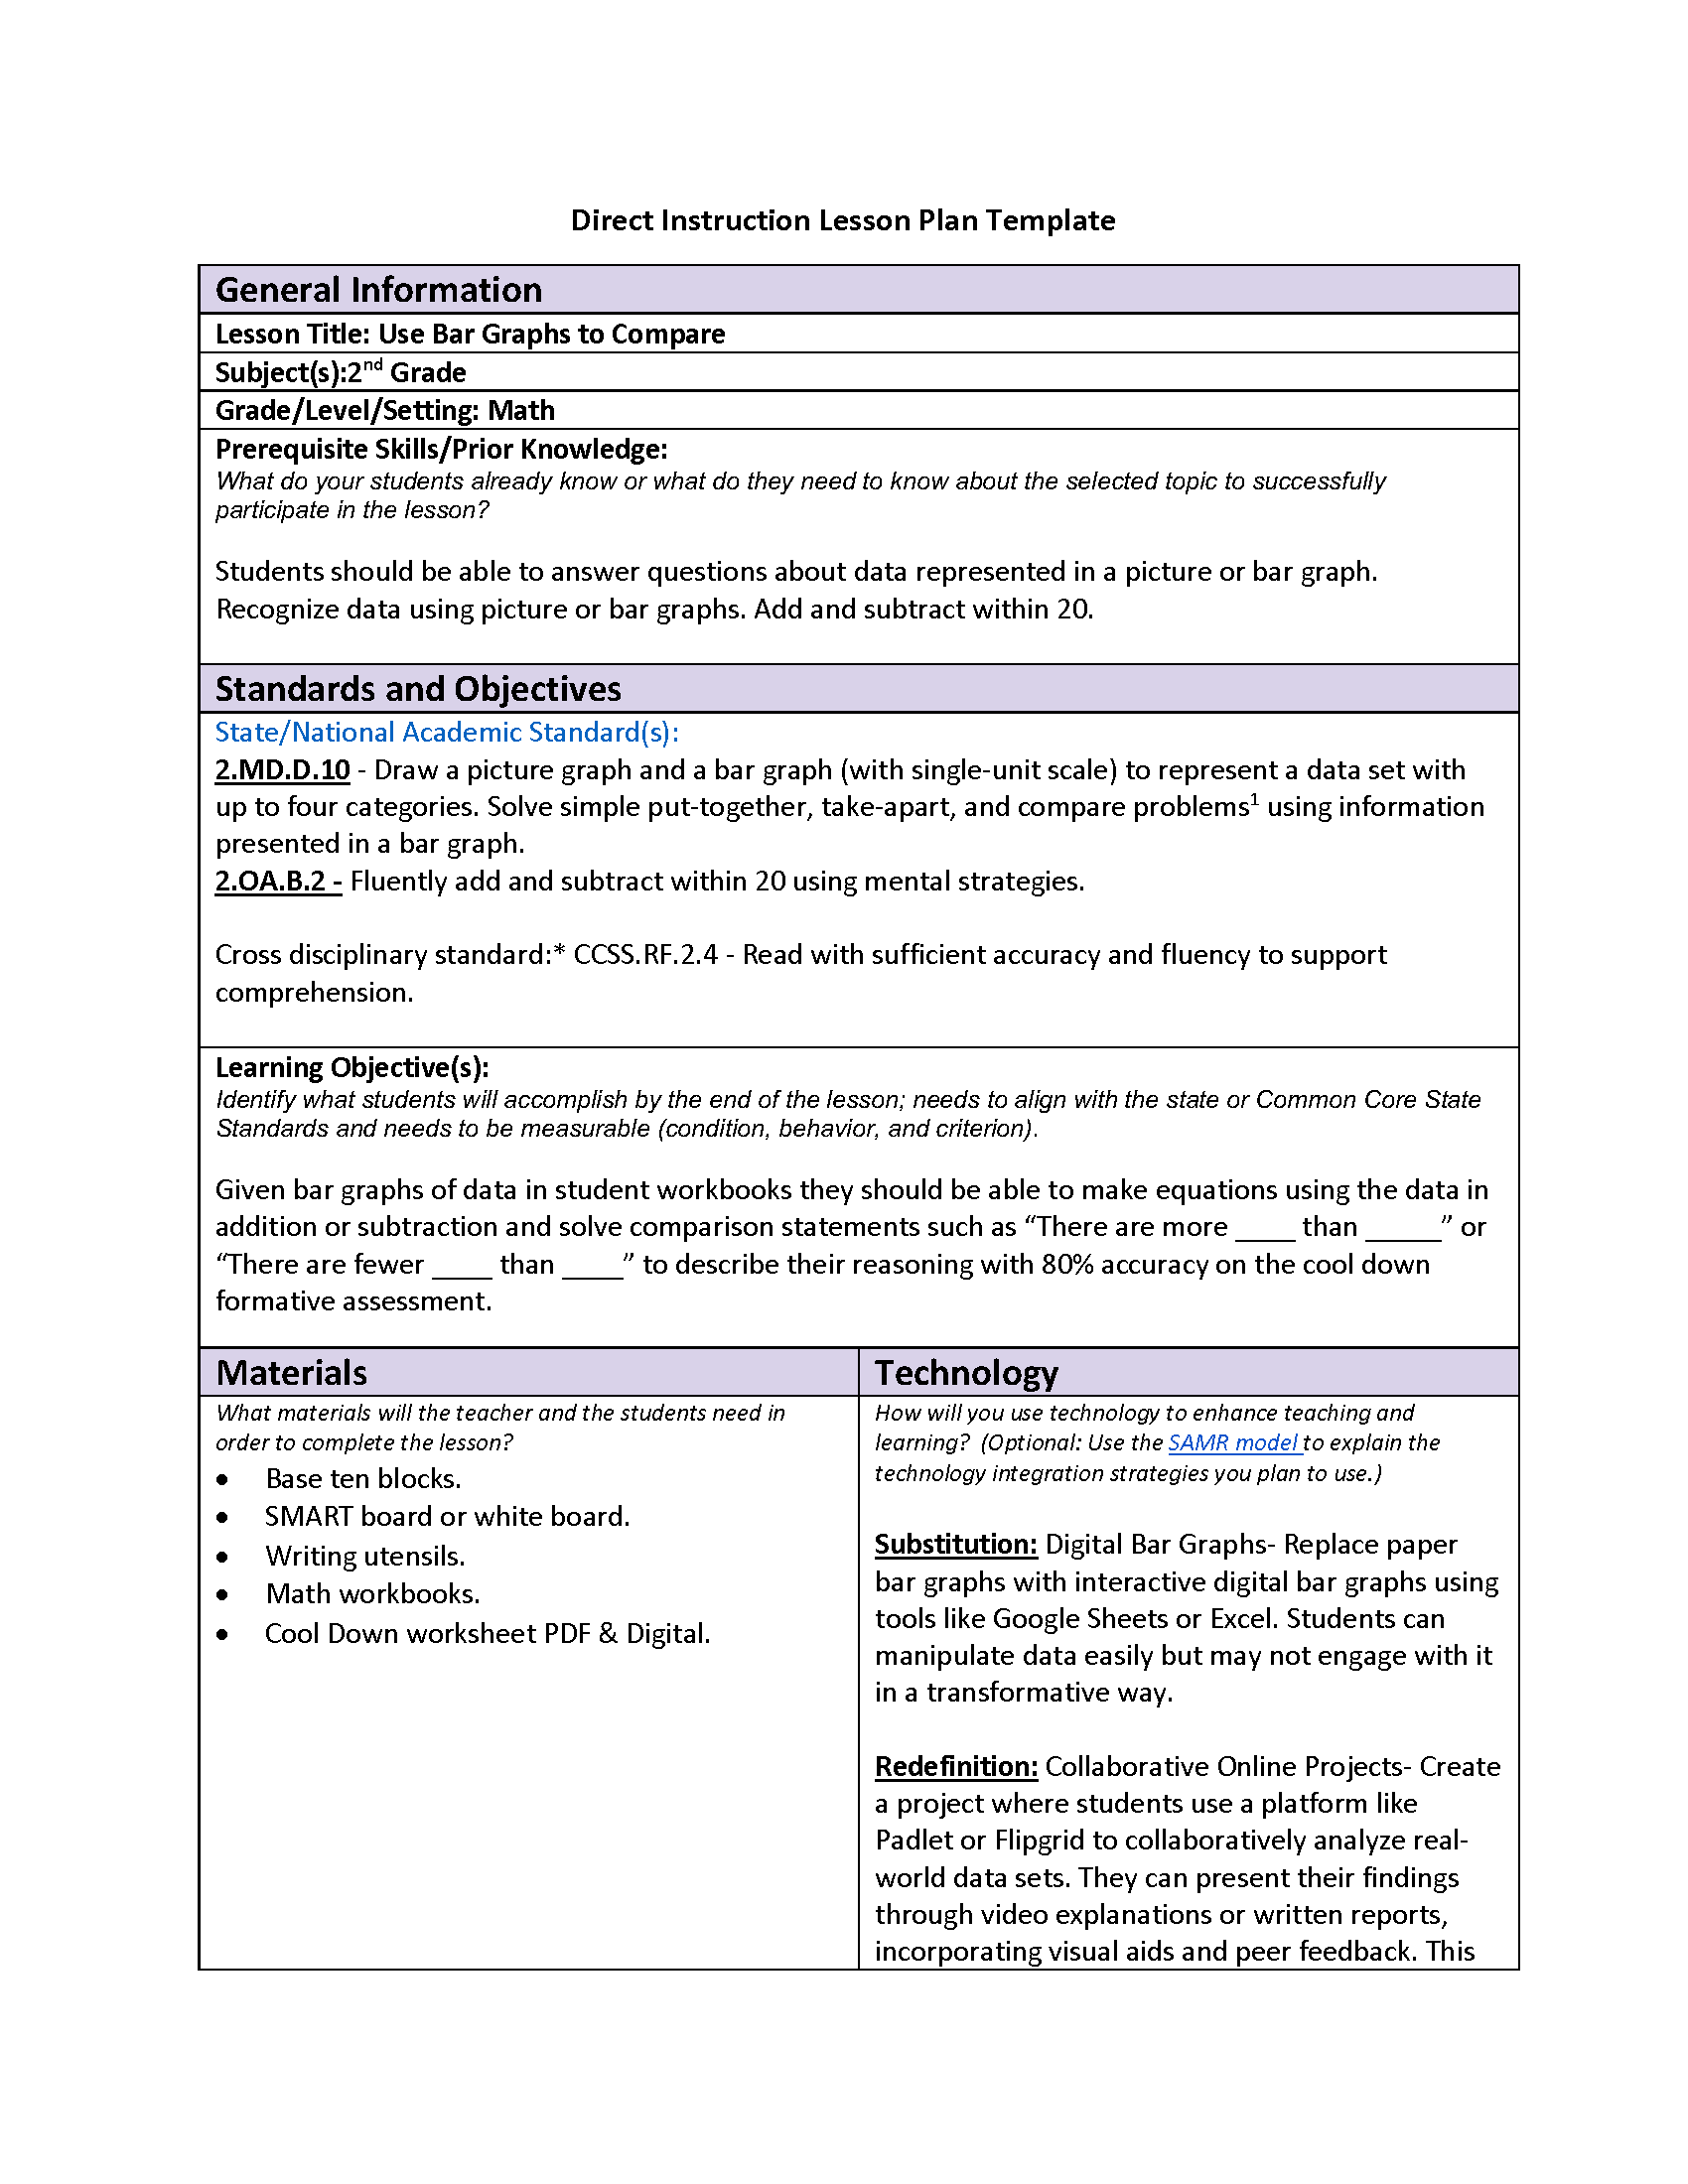
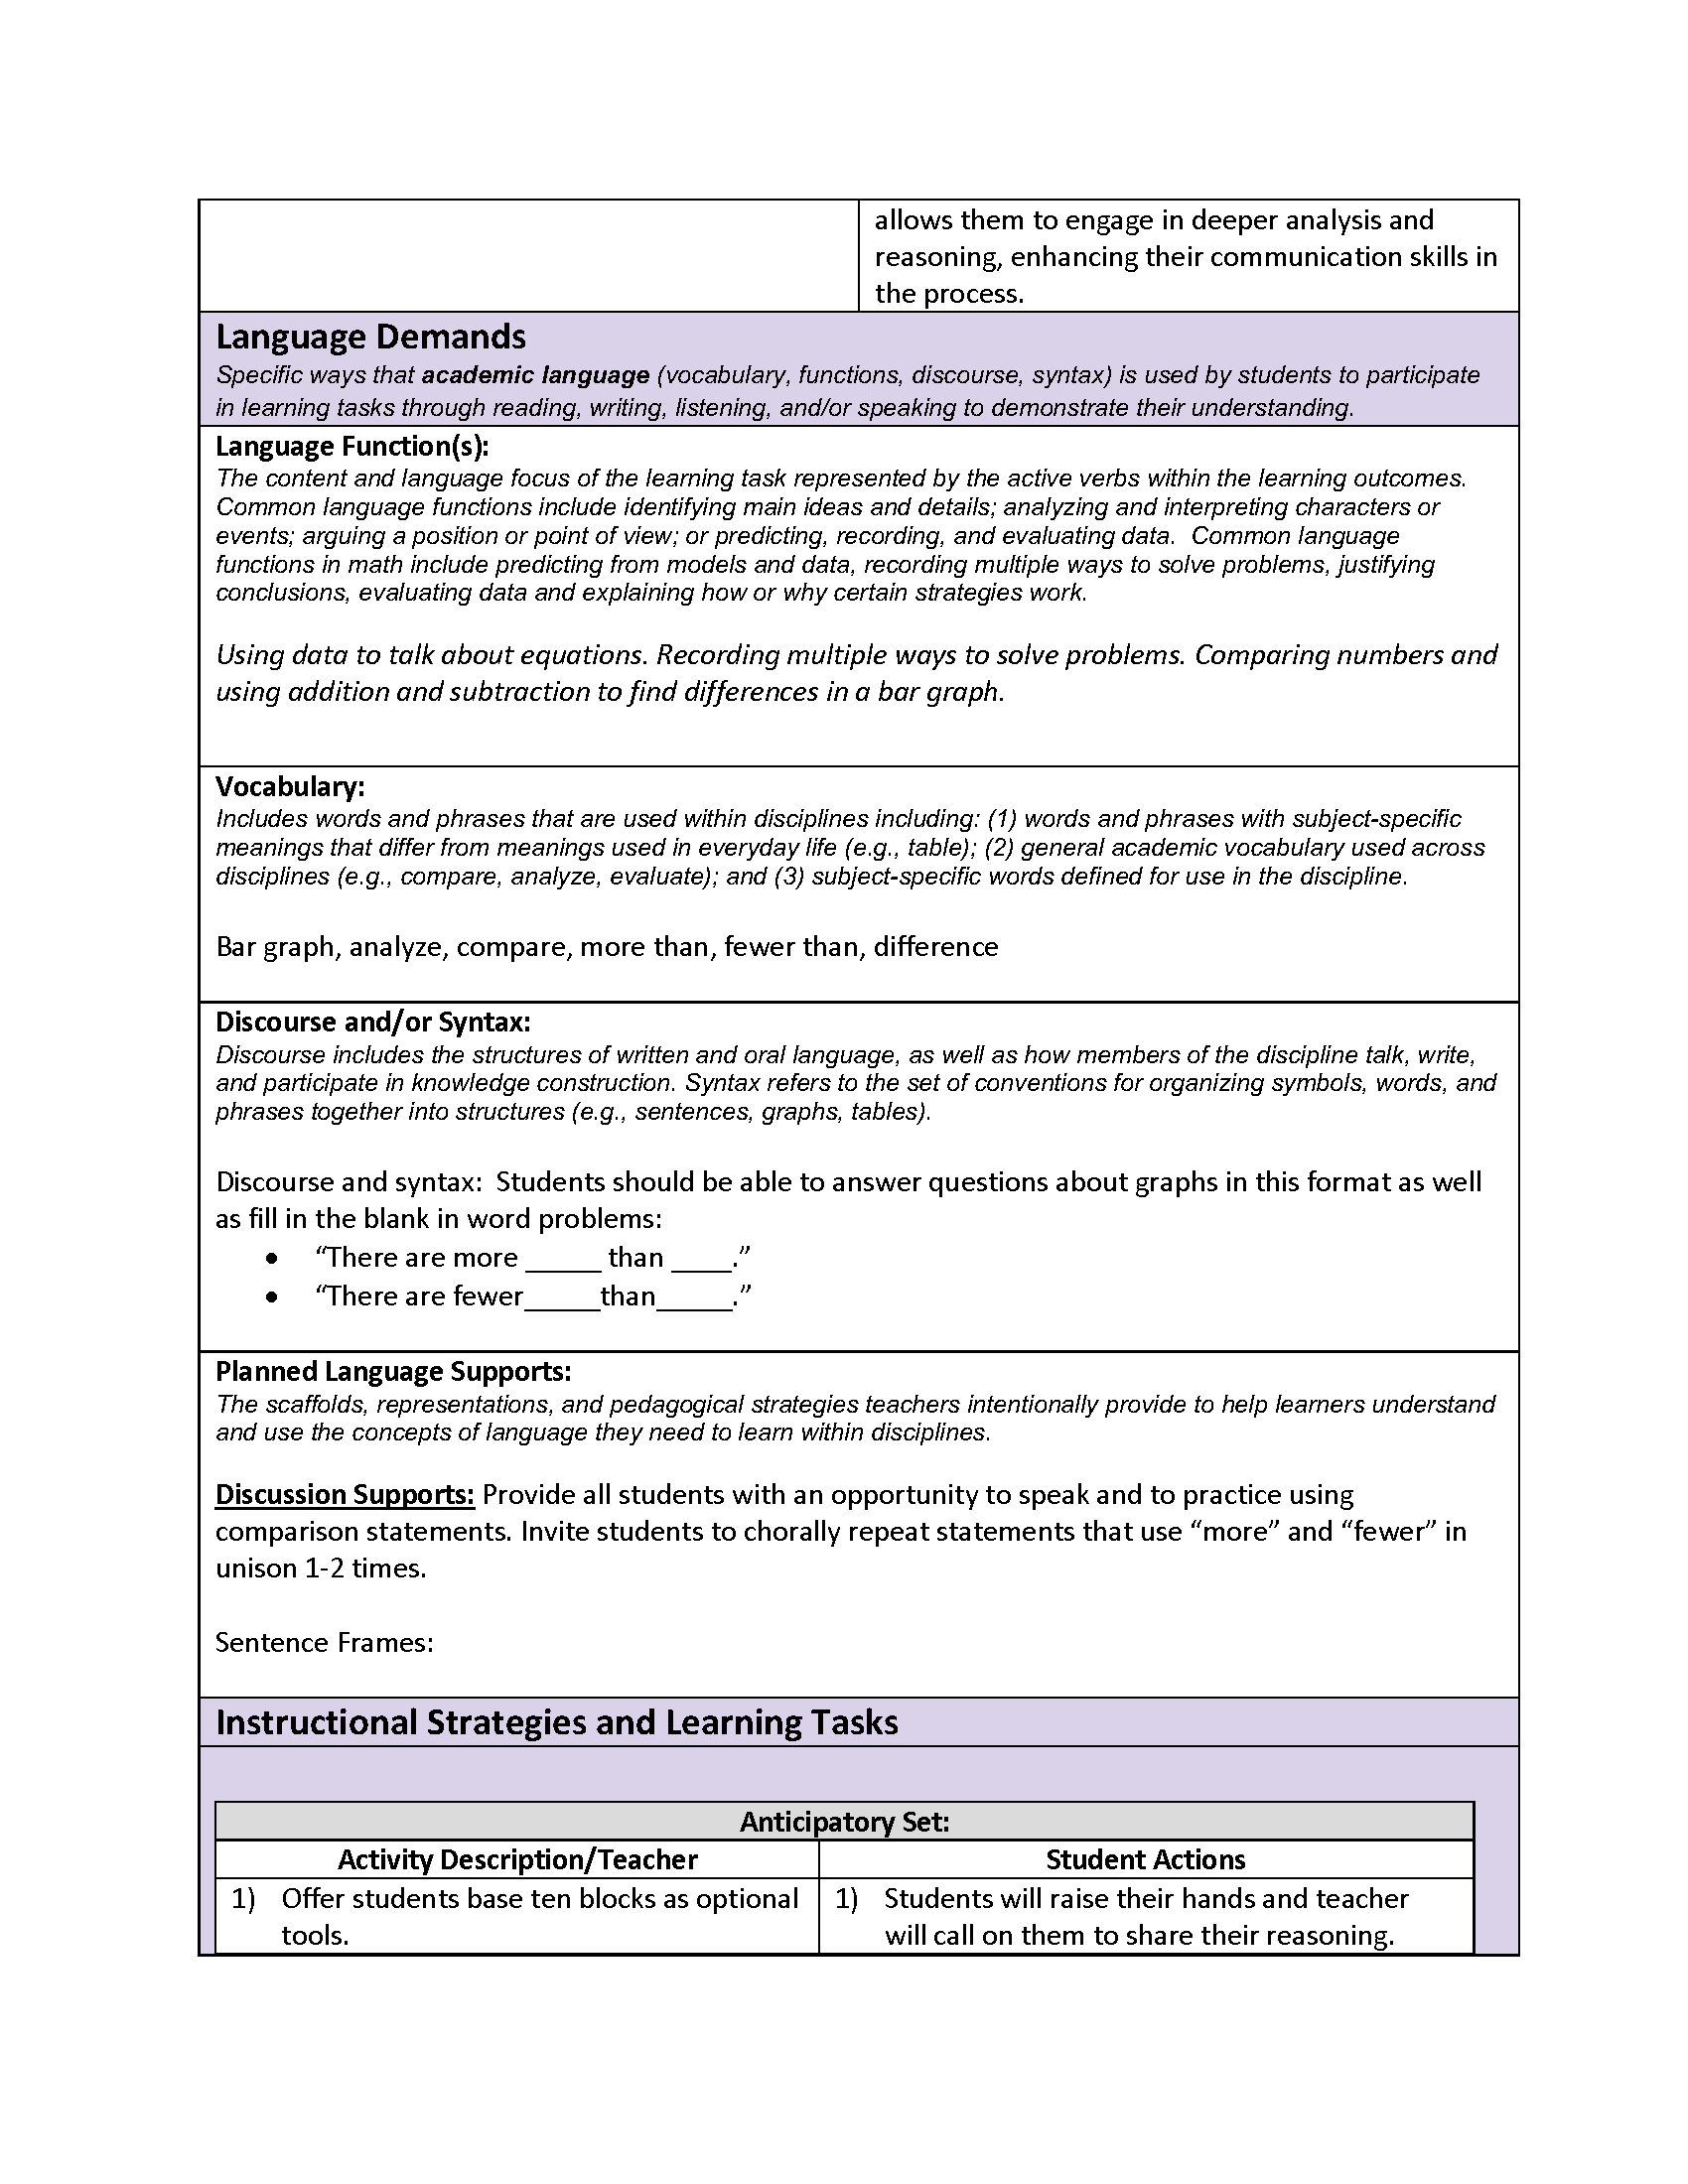
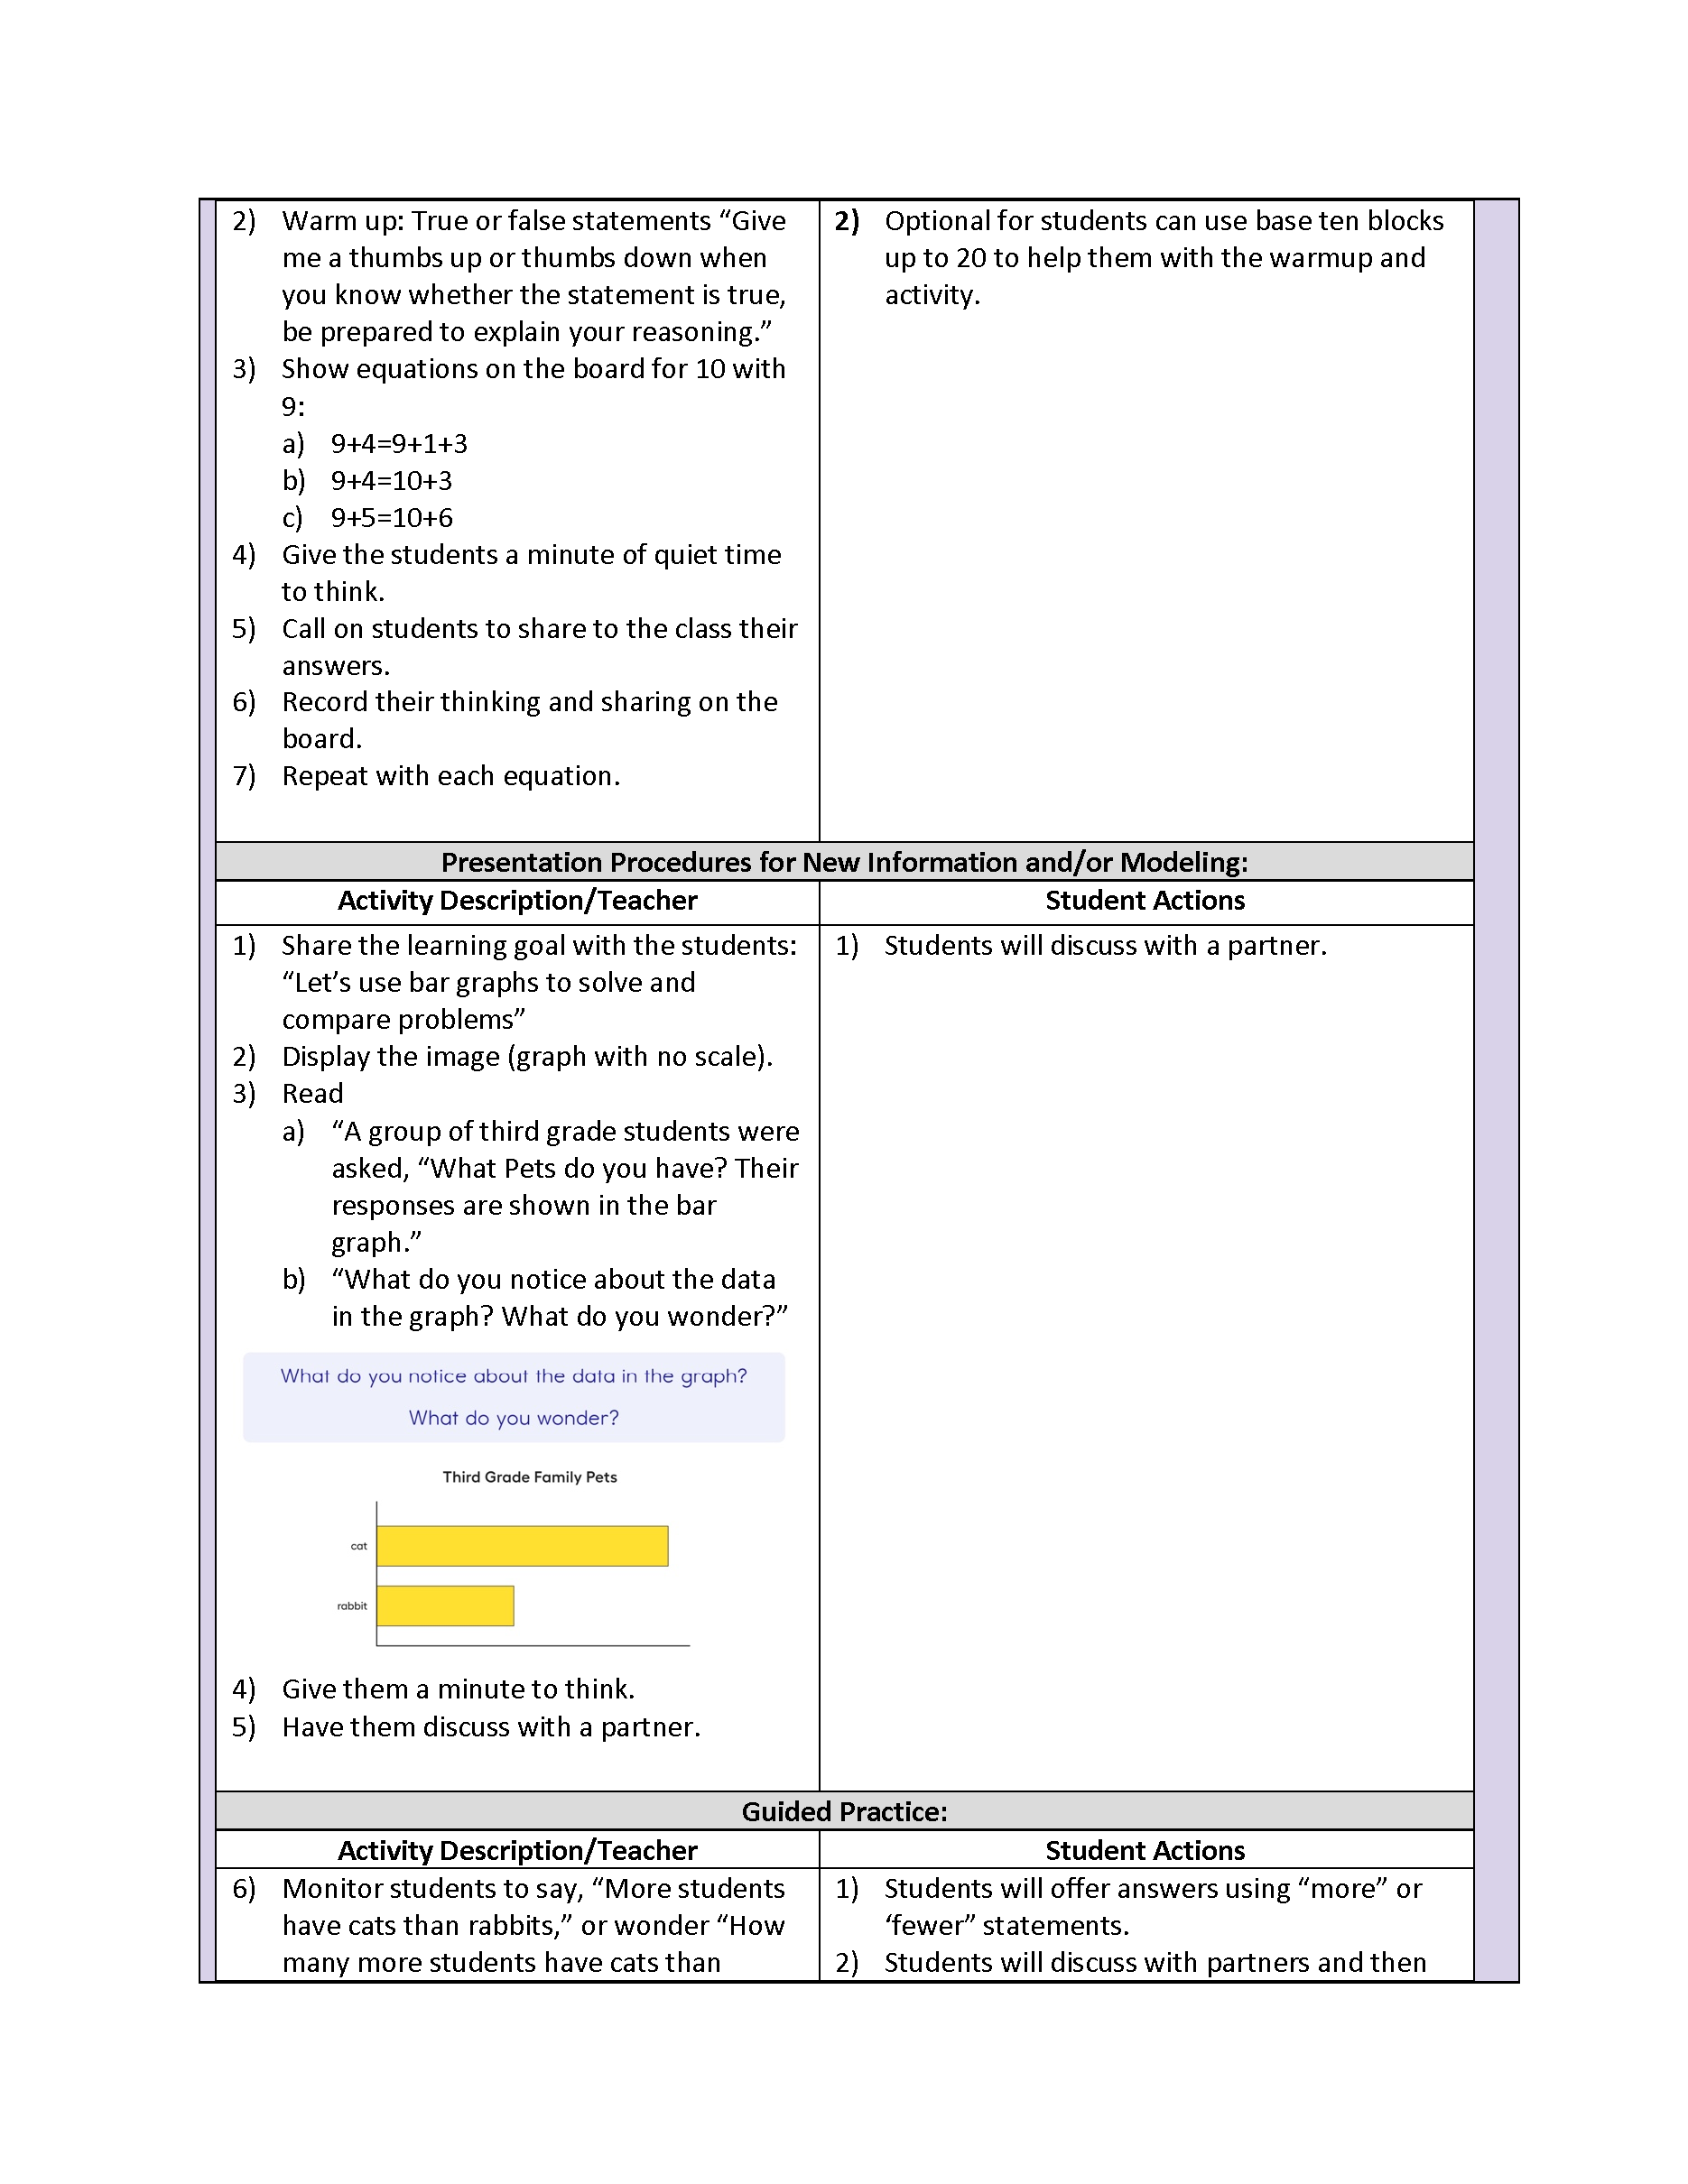
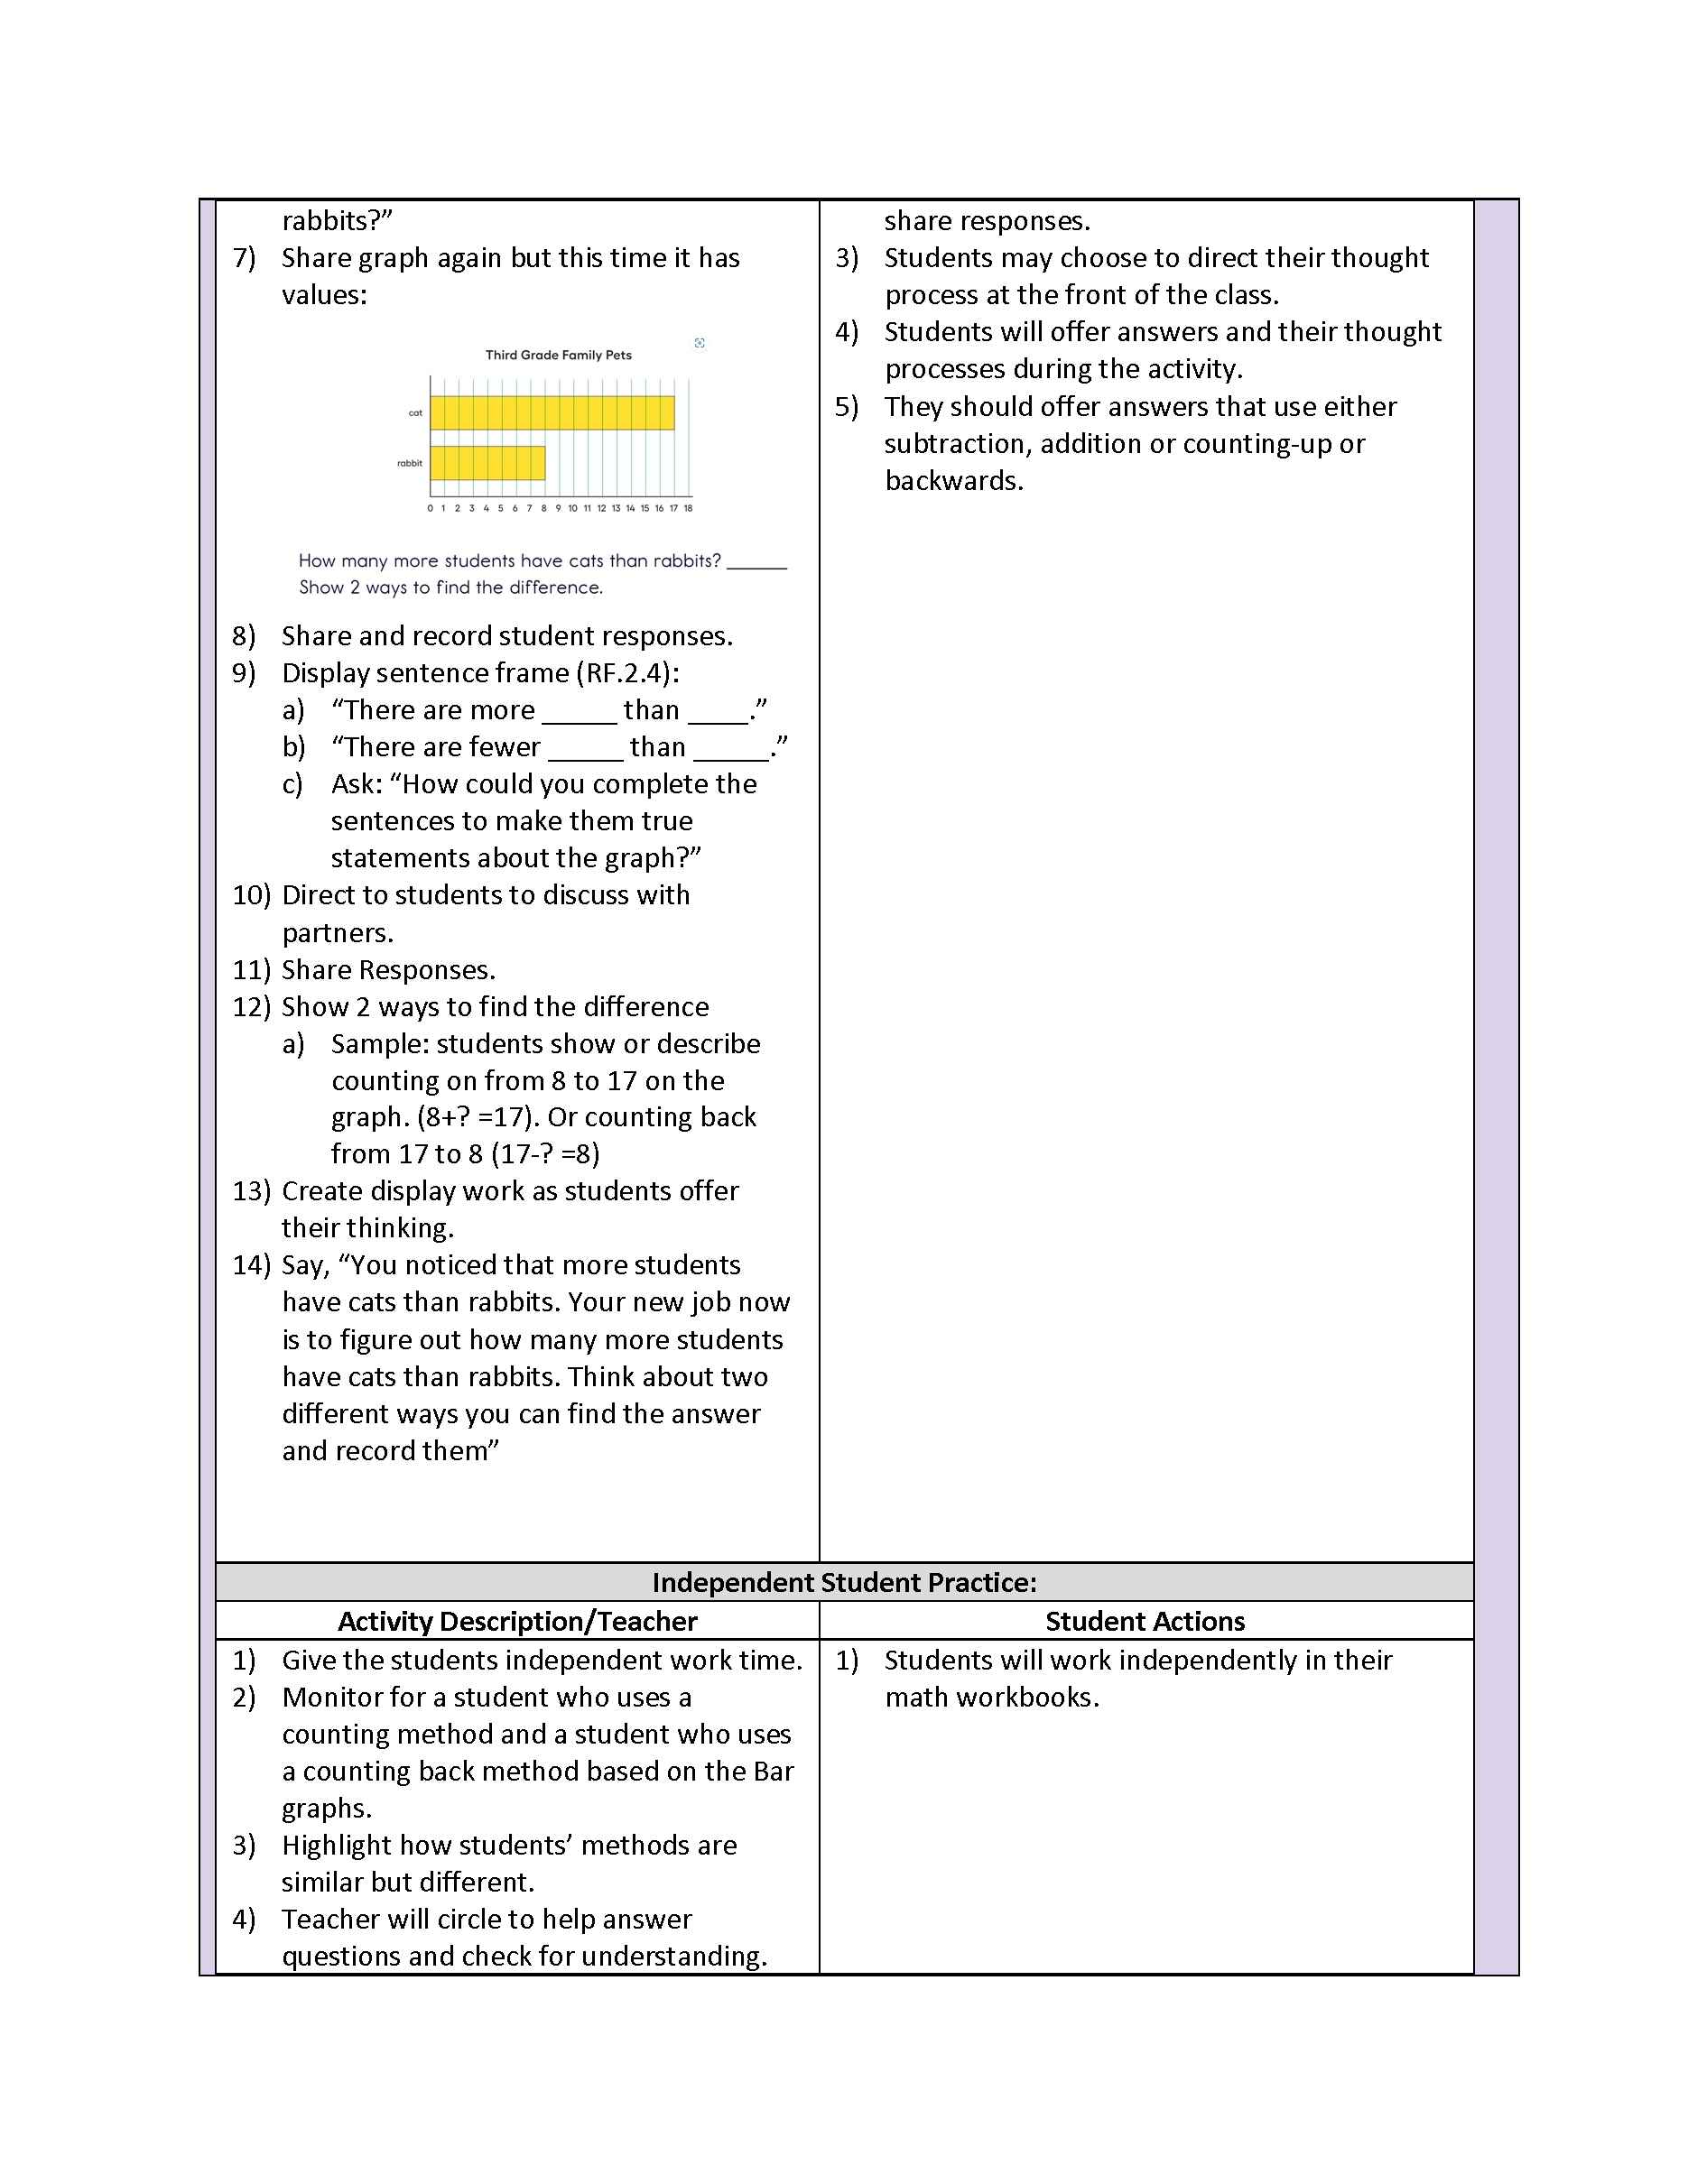
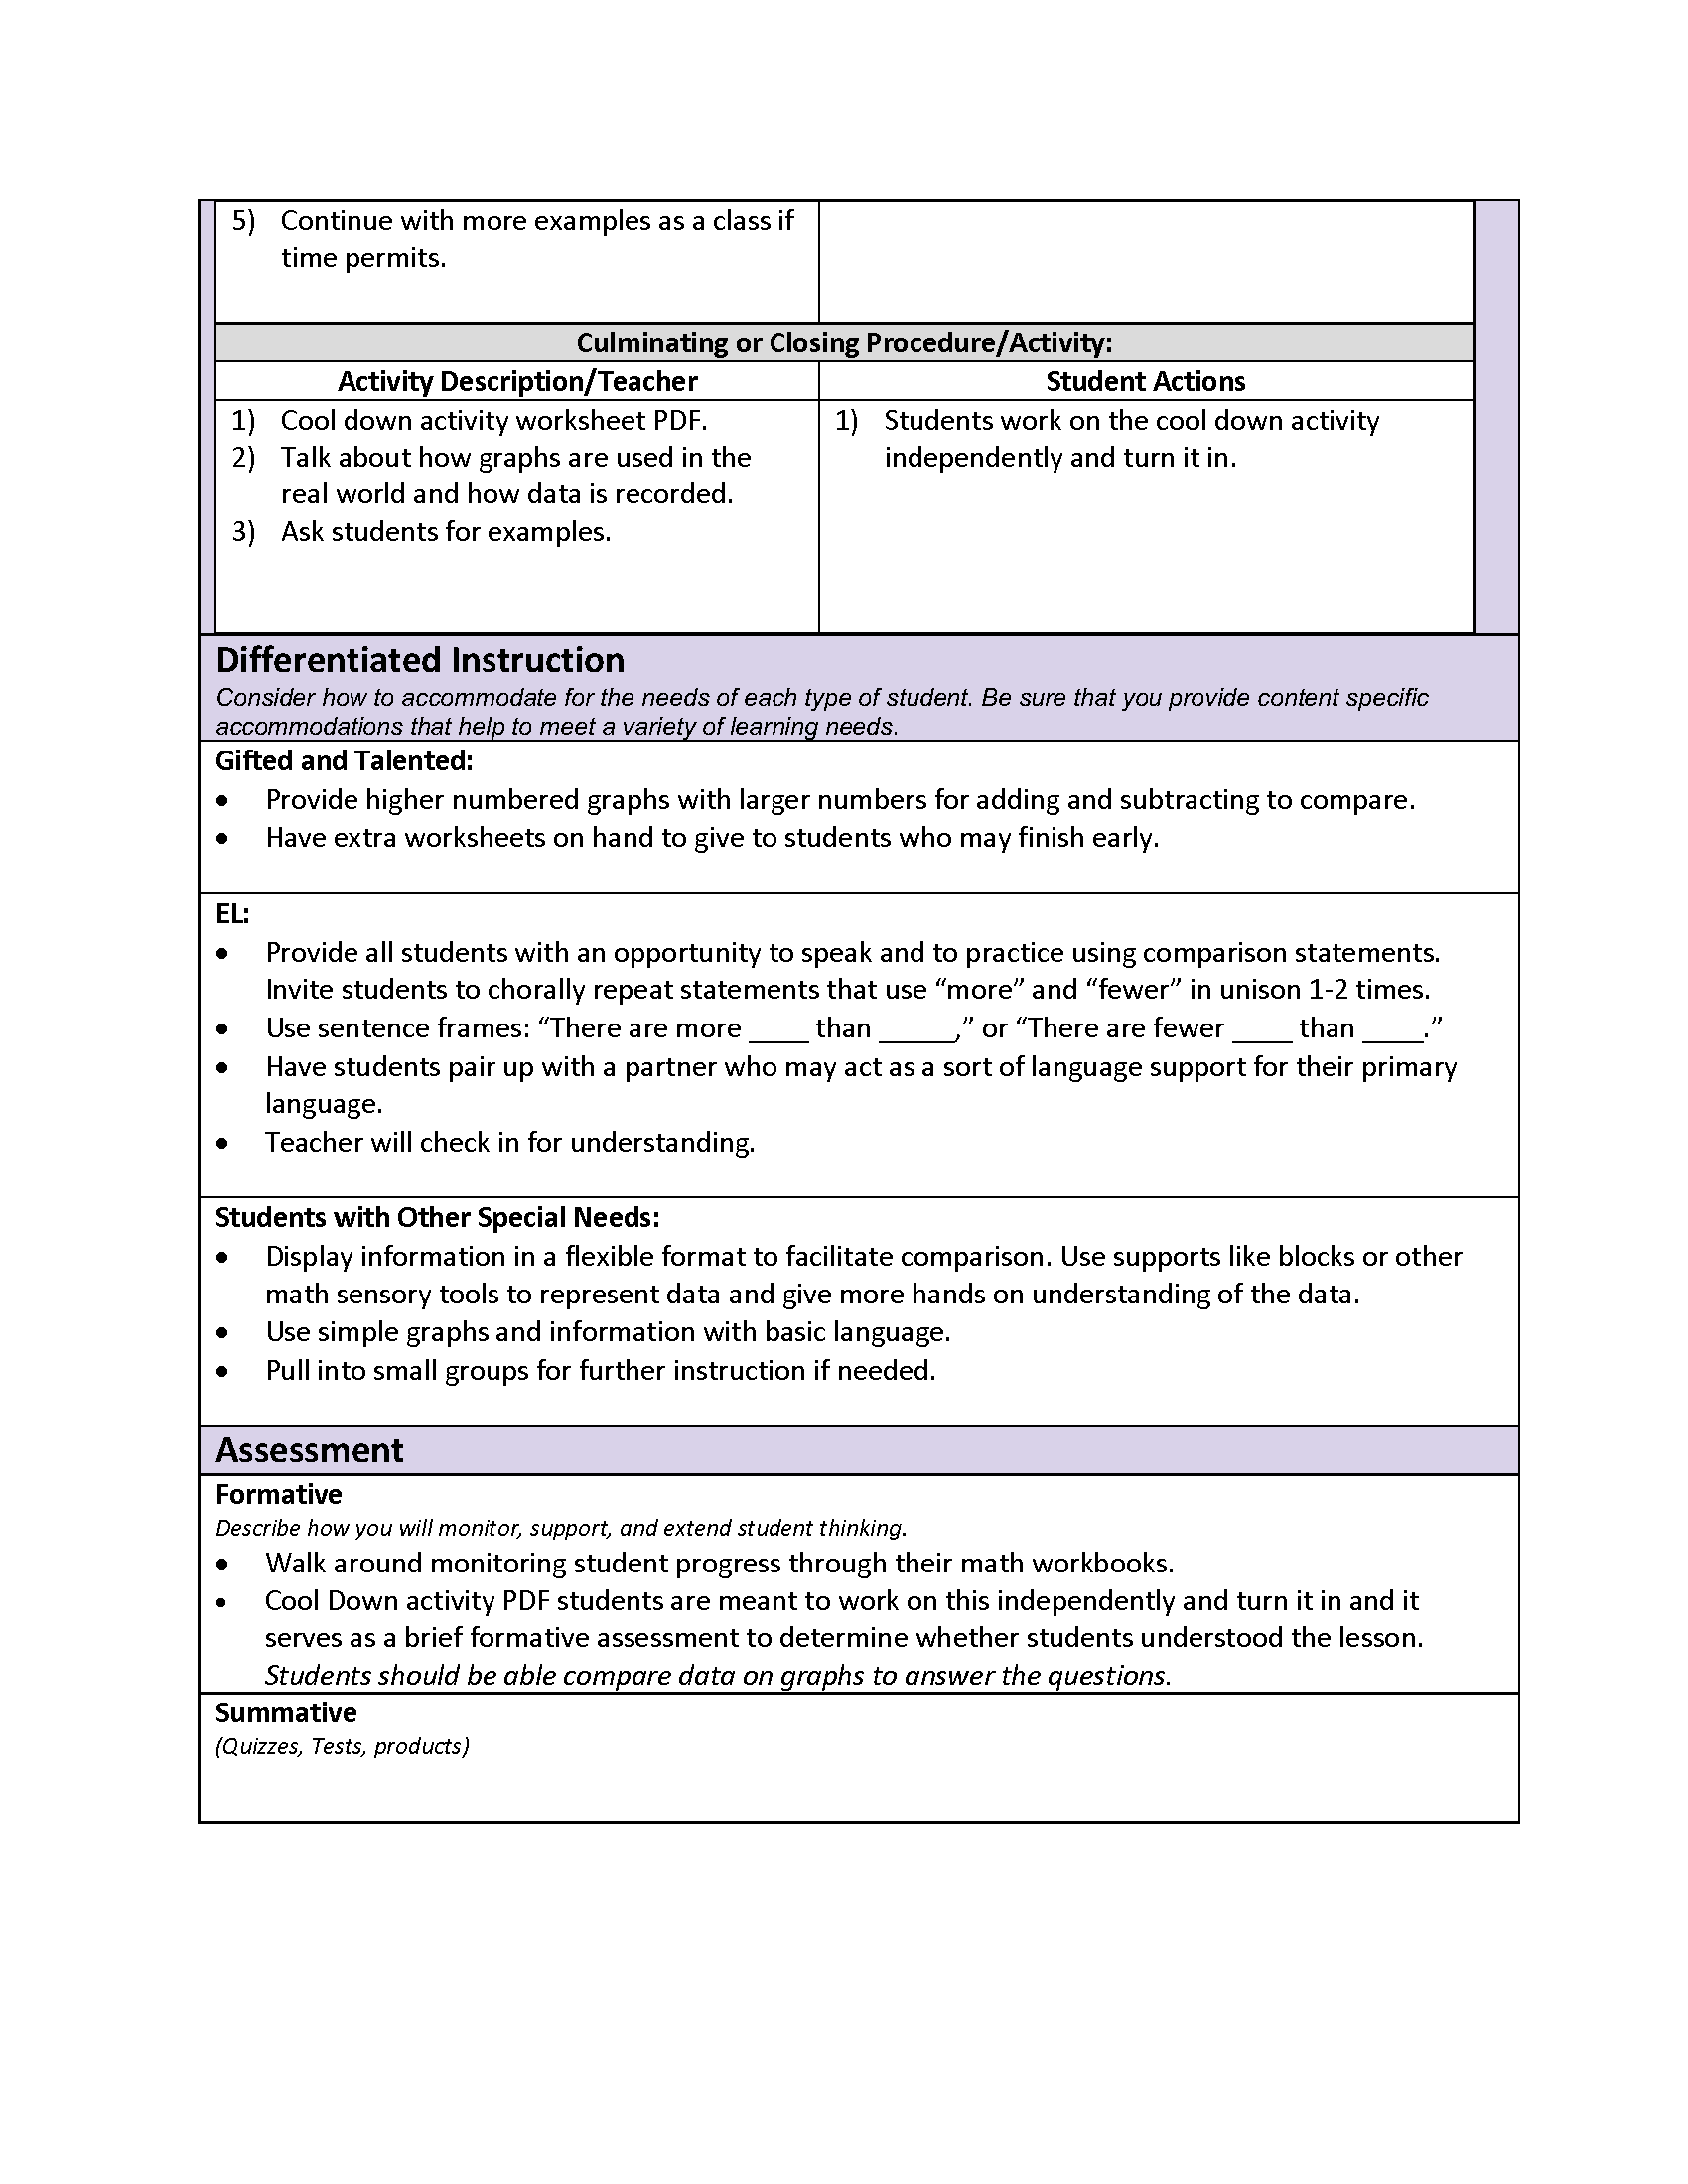
The math lesson plan I developed, "Use Bar Graphs to Compare," which focuses on using bar graphs to compare data, demonstrates my competency in using educational technology to engage students. I incorporated traditional tools like base ten blocks and digital resources like interactive bar graphs on the SMART board in this lesson. The lesson provided students with hands-on practice in manipulating data to solve real-world problems using addition and subtraction. By integrating technology, I allowed students to interact with the material in ways that went beyond static paper-based activities. For example, students could visualize and manipulate data using digital bar graphs, facilitating a deeper understanding of mathematical concepts. This interactive approach made the lesson more engaging and helped students improve their data analysis and problem-solving skills. The use of technology, therefore, directly impacted their learning by encouraging active participation and fostering collaborative problem-solving as students worked together to analyze data and share findings.
Based on the lesson's effect on student learning, I would make several modifications for future use. While using digital tools enhanced the lesson, I noticed that some students struggled to transition between traditional and digital data representations. I would provide more guided practice to address this, specifically focusing on the connections between paper-based and digital bar graphs. Additionally, I would incorporate more formative assessment opportunities throughout the lesson, such as quick check-ins using interactive polling tools or real-time feedback platforms like Padlet. These tools would allow me to gauge student understanding more effectively and immediately adjust my teaching. Lastly, I would integrate more collaborative online projects, where students can work in groups to analyze real-world data sets, reinforcing their technological skills and ability to apply mathematical reasoning to everyday contexts.
